
Below is a hand coded (in R) K-Nearest Neighbor algorithm. The algorithm is built to accept any 2dim dataset and will output a label vector. I really just put this together as a way to show just how intuitive a lot of machine learning methods can be. The R code is reasonably documented, but most readers will be able to read through without documentation as everything used is base R and the implementation is very straightforward. ..just for fun. 🙂
set.seed(111)
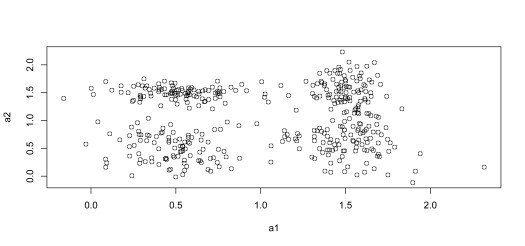
#create a basic 2 dim sample data set with four apparent cluster centers
a1<-rnorm(100,.5,.2);a2<-rnorm(100,.5,.3)
b1<-rnorm(100,1.5,.2);b2<-rnorm(100,.5,.3)
c1<-rnorm(100,.5,.3);c2<-rnorm(100,1.5,.1)
d1<-rnorm(100,1.5,.1);d2<-rnorm(100,1.5,.3)
X1<-cbind(a1,a2);X2<-cbind(b1,b2);X3<-cbind(c1,c2);X4<-cbind(d1,d2)
data_<-rbind(X1,X2,X3,X4)
plot(data_)
#add a labels column
label<-rep(0,400)
for (i in 1:400){
label[i]<-floor((i-1)/100)
}
label<-as.matrix(label)
data<-cbind(data_,label)
colnames(data)<-c("x","y","label")
write.csv(data,file="data.csv")
Above is just code that can be used to generate a makeshift dataset with 4 apparent data centers
#Import our dataset
data <- read.csv("...")

set.seed(111)
#create a distance matrix function
dmatrix<-function(d){
  n=nrow(d)
  dmat<-matrix(rep(0,n^2),nrow=n,ncol=n)
  for(i in 1:n){
    for(j in 1:n){
      dmat[i,j]=sqrt((data[i,2]-data[j,2])^2+(data[i,3]-data[j,3])^2)
    }
  }
  return(dmat)
}

#create a nearest neighbor ID function
kn<-function(i,dmat,k=5){
  x<-dmat[i,] #return the row of interest
  x<-order(x) #order the row
  return(x[2:k+1]) #return the first k entries (excluding the first)
}

#create a function to output predictions based on new data
knn<-function(data,k=5){
  n<-nrow(data)
  dmat<-dmatrix(data)
  pred<-rep(0,n)
  for(i in 1:n){
  	index<-kn(i,dmat,k=k) #extract the k nearest indices using our kn function
  	pred[i]<-names(sort(table(label[index])))[1]
  }
  return(pred)
}

#run the function and assign the output to the variable x
x<-knn(data)
cbind(data$label,x)
t<-table(data$label,x);t
#   x
#     0  1  2  3
#  0 98  2  0  0
#  1  4 92  0  4
#  2  0  0 99  1
#  3  0 13  1 86

cat("the proportion of correct classifications is: ",(t[1,1]+t[2,2]+t[3,3]+t[4,4])/sum(t),"\n")
#the proportion of correct classifications is:  0.9225
As can be seen in the preceding table, the algorithm correctly classifies most of the data points in our data set (the values on the diagonal).
 Below is an R implementation of a k-means clustering algorithm written recently for recreational purposes. The algorithm will accept an arbitrary
  Below is an R program that will optimize a particular knapsack using the Metropolis-Hasting algorithm, a Monte Carlo Markov chain. The beautiful MH algorithm has been a recent focus of mine and I am finding that it’s applications are basically limitless. I’ve also posted this one to my


